The US stock market, which is breaking records almost everyday, is attracting much attention from both investors and media.
However, the market is not in risk-on mode every day.
A reading of the full history of the Dow Jones Index between 1896 and now will show that the up-to-down ratio, calculated on a daily basis, is 53:47.
That ratio rises to 60:40 when calculated on a monthly or a quarterly basis, but is still about 70:30 even in a one- to two-year timeframe.
This means the market is in risk-off mode for at least a quarter or even up to half of the time.
Thus, safe assets should always be an alternative.
The gold or silver markets are too small to absorb the risk-off money from the stock market.
The only sensible alternative is "cash," but the risk-off funds are indeed stored in the sovereign bond markets.
Longer tenors are usually more preferred as the shorter ones are too close to the policy rates, which have been hovering near zero over the past two decades.
Yield curves are, after all, normally upward sloping, except for one or two years before a recession when stock markets are still good.
There are mixed factors affecting long yields.
Theoretically these include the prospects of real activity (real GDP growth) and inflation.
Empirically, however, only inflation is found to be relevant when it exhibits roughly 60-year long cycles with the long yields.
However, the relationship is pretty loose so that there are discrepancies, even up to the quarterly timescale.
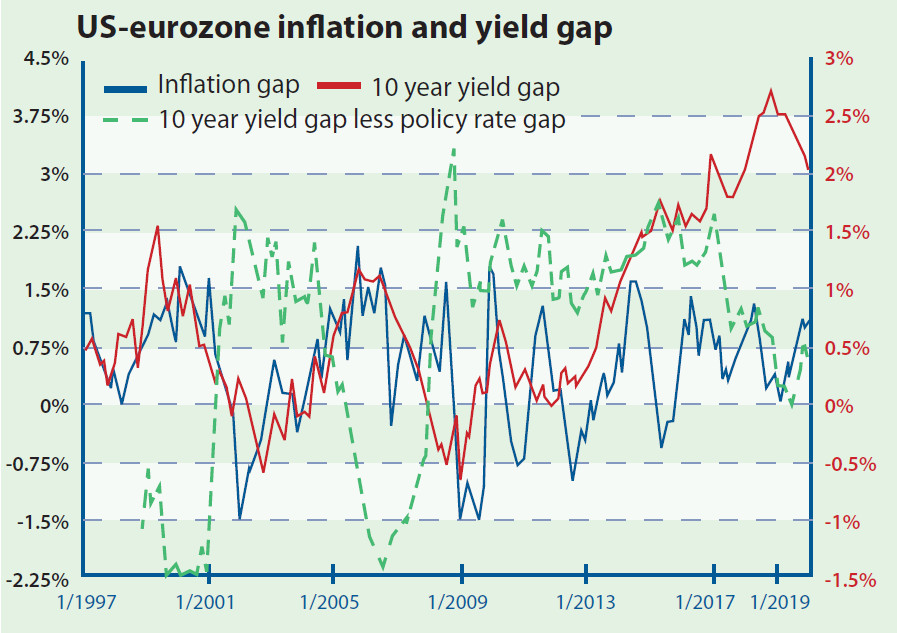
To extract more market information from the macro situation, we can compute the inflation rate gap between the US and eurozone, then compare that with the long yield gap between these two economies.
In principle, they should commove, but this was only the story before late 2014.
After that, the inflation gap is still contained while most of the time it is below 1.5 percent, while the US-eurozone 10-year sovereign yield gap has been widening to above 2 percent in recent years.
The underlying reason for such a discrepancy is obvious because the Federal Reserve has started raising rates since late 2015.
The long yield always prices in policy changes early, and this is especially true when central banks tend to announce decisions well ahead of actual actions.
To account for this, the policy rate gap is now subtracted from the long yield gap, that is, the US-eurozone 10-year yield gap minus the US-eurozone policy rate gap.
Put differently, this is nothing but the difference between slopes of yield curve of the US and eurozone, or the difference between the outlooks for the US and the eurozone economies.
How is this useful then?
It is found that this is more correlated to the recent yield gap.
That says that in the past the long yield reflects the inflation situation more, but now it embeds more information on the real outlook.
Maybe in this era inflation is no longer a concern so that the market focus is switched.
So ask yourself: which economy, the US or the eurozone, has better prospects?
Then you should know which sovereign bond market acts better as a safe haven when you need one in the future.
Law Ka-chung has worked in the financial industry and the government for two decades Reach him at facebook.com/kachung.law.988 or lawkachung@gmail.com