People are saying that we are in the grips of a global recession or even a depression.
From chief executives at major funds to professors at top educational institutions, their estimated probability of a recession is at least 90 percent, if not almost a sure thing. But what about predictions based on that well-regarded crystal ball – the Treasury yield curve?
The Federal Reserve Bank of Cleveland has been calculating the probability of a recession based on the yield curve via a probit model.
The right-hand side of the model constitutes a yield gap and some other auxiliary variables, where the former is the long-short yield difference, usually from 10-year and three-month tenors.
The left-hand side is, of course, “recession,” which takes a binary possibility 1 or 0 so that it is “probit.” The underlying distribution assumes normal.
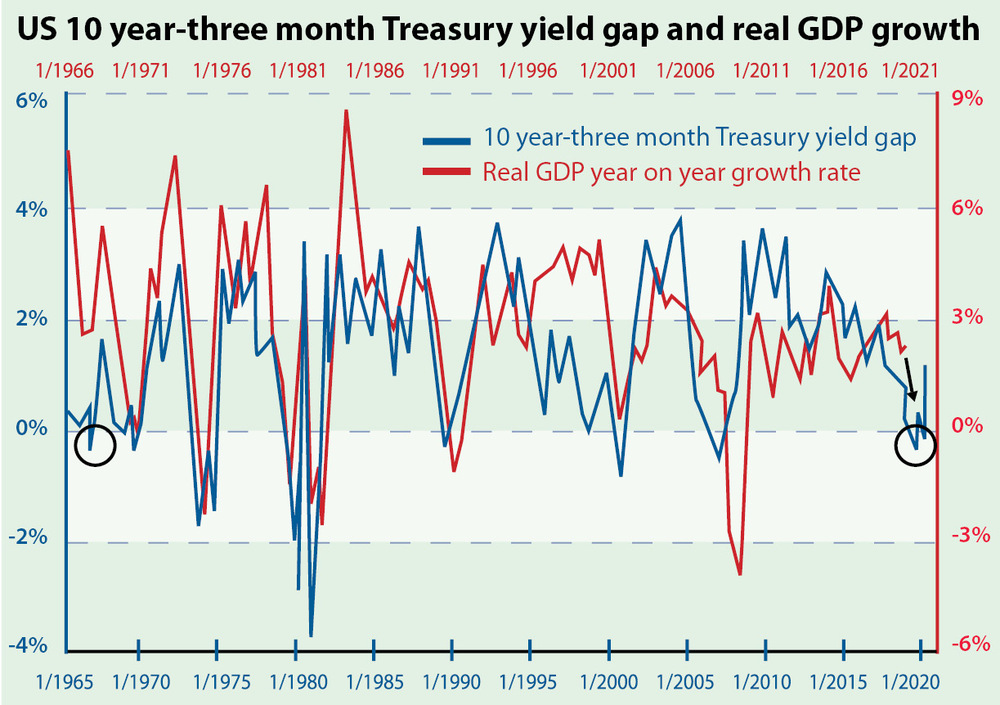
To visualize the intuition behind it, the yield gap with real GDP growth is compared here. The reason why it is so famous is two fold.
One is the foreseeability, where the yield gap turns negative in four to six quarters ahead of a recession.
Another is its accuracy: that there had been just one wrong signal out of a total of eight made in 1967 where a recession did not ensue.
The only wrong signal made that year is that the yield curve (ie, a negative yield gap) inverted by no more than 50 basis points (or 0.5 percent) and lasted no more than five months, as marked by the left circle in the accompanying chart.
The same signal appeared last year from late May to early October (less than five months), where inversion just exceeded 50 bps (minus 0.5002 percent to be exact) for one day at the end of August, as is shown by the right circle in the chart.
This is a very embarrassing signal for economists to take or leave. Notice that after the strict cuts down to zero by the Fed and as the market calms down a bit, the yield gap has rebounded to the plus 100 bps level.
If without shutting down all walks of activities, a fair conclusion to be drawn strictly from the yield curve is there might be a recession but the case for it is bound to be marginal.
Now that the global supply chain faces an almost immediate pause mode, so will GDP to some extent.
But from China’s experience of a shutdown, a month or two should be roughly enough to identify whether a city or region is still suffering from an outbreak with relief soon following if all’s clear.
In general, two consecutive quarters of GDP contraction are needed to define a recession.
A one- to two-month shutdown would, no doubt, cause a deep contraction.
However, whether such a contraction would last significantly more than two quarters is questionable, especially when the western economies were in good shape immediately before the coronavirus hit.
The real uncertainty here is virus mutations.
Influenza outbreaks that cause millions of deaths usually last more than a year, and the extent of the death tolls were due to variations that caused further rounds of infection.
The second-round infection of the Hong Kong flu did cause the yield curve to invert again from end-1968 to early-1970, and a recession occurred from December 1969 to November 1970.
Law Ka-chung has worked in the financial industry and the government for two decades. Reach him at facebook.com/kachung.law.988 or lawkachung@gmail.com