Read More
Germaine Share, Morningstar’s Director, Manager Research, Asia, points out that 2024 was a strong year for global equity markets, with the Morningstar Global Target Market Exposure Index returning a robust 17% in USD terms. The US market led the charge, with its continued strength in the Magnificent Seven, and investor optimism surrounding Trump’s pro-business stance. China’s stock market rebounded after suffering three consecutive years of underperformance, thanks to some aggressive policy stimulus. Many sovereign 10-year yields, including the US, UK, and Japan have continued to climb, and current yields for most major fixed income asset classes are notably higher than their five-year averages.
ADVERTISEMENT
SCROLL TO CONTINUE WITH CONTENT
Against this backdrop, global asset under management reached new heights, at almost USD 60 trillion in 2024. 2024 was the second-strongest year in terms of inflows over the past 20 years, with over USD 2 trillion pouring into the fund industry. Almost half of the inflows went to money market funds, as investors continued to be attracted to their relativity high income and low risks amid years of market volatility. The elevated bond yields in recent years, and the recent onset of the global rate cut cycle also drove investors to fixed income funds.
A loser amid this robust flow picture was thematic funds. Thematic funds are where investors often suffer the most from the classic “Buy High, Sell Low” behavior. Funds focused on energy transition and technology saw a spike in inflows in 2020 and 2021 as they were heavily promoted to investors at the peak of the market when returns are strong. These themes tend to be growth-oriented, which have become out of favor in recent years. Along with a narrower investable universe, these funds tend to underperform peers that benefit from a wider opportunity set over the longer term. As a result, returns deteriorate, investors get discouraged, and they pull out of the funds at their low points.
Winners in a Consolidating Asset Management Industry
ETFs are undoubtedly the winner in the global asset management landscape. ETFs had a record year in 2024 both in terms of assets under management and inflows. The three largest ETFs in the world – SPDR S&P 500 ETF Trust, iShares Core S&P 500 ETF, and Vanguard S&P 500 ETF pulled in over USD 200 billion in 2024 on the back of the S&P 500 Index returning a robust 25% in 2024. While many Asia-based investors have been going to the US market for ETFs, there has been a rise in popularity for locally listed ETFs in Asia. In Taiwan, high-dividend ETFs dominated the fund flow league tables, and investors can also buy money market funds in the form of locally listed ETFs in certain markets like Hong Kong.
In the US, Vanguard and BlackRock have been the primary beneficiaries of the inflows into passive investments. Vanguard commanded an impressive 29% of the overall mutual-fund and ETF market in the US thanks to its cheap and core-oriented index funds, topping the chart by a long shot, with USD 8.5 trillion in AUM as of the end of August 2024. BlackRock came in second, thanks to its iShares business, but at a much smaller 12% market share. The top three firms, Vanguard, BlackRock, and Fidelity comprised more than half of fund AUM in the US. Overall, the largest 20 firms soak up a whopping 85% of AUM, which means the remaining firms fight over 15% of the AUM in the US fund industry.
Already known for its low costs, Vanguard announced its broadest fee cut ever in its 50-year history across almost 90 funds in February this year, and it seems like the decade-long fee pressure is not going to subside.
Predictive Power of Fees
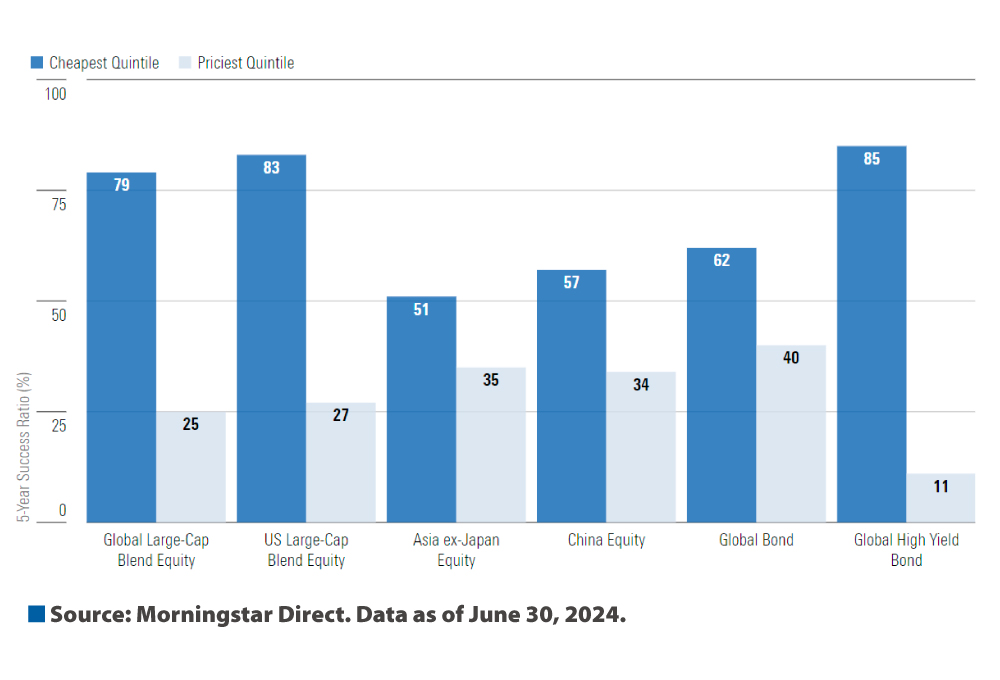
“We think investors win in this situation,” says Share. “We have done various studies that have repeatedly proven that fees are a reliable predictor of a fund’s future success.” In fact, the Morningstar Medalist Ratings methodology considers fees at the share class level to better reflect their impact on a strategy’s net-of-fees expected alpha. This chart shows the five-year success ratio of some of the key asset class building blocks in an Asian investor’s portfolio. The success ratio measures the precentage of funds that both survived and outperformed their category peers during the study period. Across all prominent categories that we examined in this study, funds in the cheapest fee quintile achieved a higher success ratio than those in the most expensive quintile.

Germaine Share, Director, Manager Research, Asia.